
Below, there is a table from a study published in the year 2000 by Weyer, Walford and colleagues (1). The study described human metabolism during and after 24 months of (unintended) caloric restriction experiment in the “Biosphere-2” confinement.
The interesting fact that we see in the data (the table below) is the reduction of “spontaneous physical activity” by almost a half in the calorie-restricted subjects in comparison to controls. This marker, “spontaneous physical activity” remained low even 6 months after the calorie restriction ended.

The diet in the Biosphere-2 was a high carb diet.

“Spontaneous physical activity” can theoretically be used as a marker of “general vitality”. It is possible that when “spontaneous physical activity” is low, the individual is less motivated and less active in many areas of his life. Some may even feel lethargic”.
This is something that we periodically observe in our consulting practice. Many people go on the popular restrictive diets, miscalculate their energy needs and “intuitively” undereat. Spending months in a calorically restricted state, as we can see from the study by Weyer and Walford (1), may result in subtle changes in behavior that are not easily reversed.
In the snapshots below, you can see one of the participants of the “Biosphere-2” 24-month experiment with involuntary caloric deprivation, Roy L. Walford. The photo is from another study describing the experiments.
At the end of the experiment, Walford looks unhealthy. The impression is partially due to an almost complete loss of fat mass.
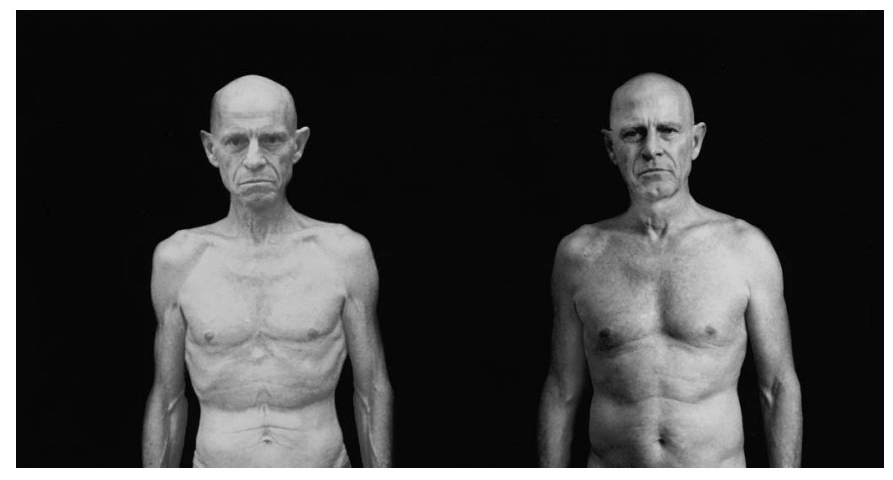
We, somewhat forensically, identified Walford in the list of participants’ characteristics. We can see that at the end of the 24 months, skeletal looking Walford had a BMI of 18.


Our consulting clients, as well as people who follow our research on SHBG, will take a note of how Walford’s SHBG evolved during the observation period. Walford was 67 when he entered the “Biosphere-2” confinement. When he already looked skeletal, his SHBG was not so bad for a 67 years old man. During the recovery period, Walford’s SHBG even went down to 31nmol/L.

The verdict.
Beware of an excessive or an unintended caloric restriction on the currently popular restrictive diets of all kinds. Eating intuitively, another currently popular trend, may not always work. Undesirable changes in hormones and in behavior may occur.
Selected References:
1. Christian Weyer, Roy L Walford, Inge T Harper, Mike Milner, Taber MacCallum, P Antonio Tataranni, and Eric Ravussin,
Am J Clin Nutr 2000;72:946–53.